It's accepted wisdom in SEO that rankings will fluctuate, sometimes by a little, and sometimes by a lot. There are far too many variables at play for this not to be the case, but have you ever wondered exactly how much rankings fluctuate in any given day?
We have, so recently we decided to do a little test. At Greenlight we already rank check an eye popping number of keywords on a pretty regular basis, but for this test we decided to up the ante.
We took 1,000 keywords and recorded the top 100 ranking sites for those keywords 10-15 times over the course of a single 24 hour period. This resulted in a record of approximately 1,000,000 URLs, and the ranking fluctuations they had experienced within the space of a single day (starting and finishing the test in the evening).
- 1,000 Keywords
- 1,000,000 URLs
- 24 Hours
This should be interesting...
Number of URLs That Fluctuated
Of the recorded ranking URLs, 82,480 experienced at least one fluctuation of at least one ranking position. That's about 8% of our data set.

At first I was slightly surprised that this figure isn't higher, as I seem to hear a lot of anecdotal stories about strange ranking fluctuations, but on reflection 8% seems more than enough to allow Google to do its testing and maintenance and everything else it needs to do to cause these fluctuations.
Degree of Fluctuation
Charting those 82,480 fluctuating URLs according to how much they fluctuated results in this:
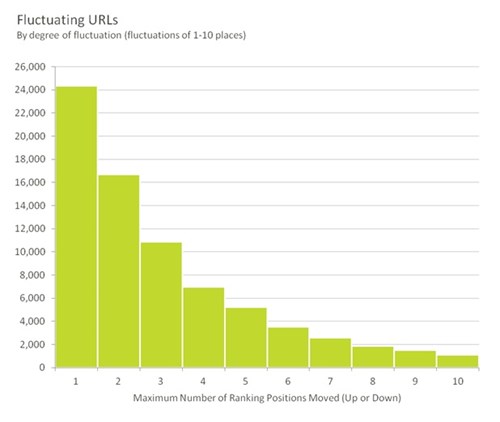
Clearly, the vast majority of fluctuations are fairly minor, with over 50% of our total observed fluctuating URLs moving up or down the rankings by 3 or less places. That being said, 3 places can be a pretty big deal when it moves you from position 8 to position 11.
There were also a relatively minor number of URLs that fluctuated by more than 20 places:
Here's all that data in tabular form:
|
Positions Changed |
# of URLs |
% of Fluctuating URLs |
|
1 |
24368 |
29.5% |
|
2 |
16710 |
20.3% |
|
3 |
10877 |
13.2% |
|
4 |
6977 |
8.5% |
|
5 |
5226 |
6.3% |
|
6 |
3519 |
4.3% |
|
7 |
2573 |
3.1% |
|
8 |
1850 |
2.2% |
|
9 |
1503 |
1.8% |
|
10 |
1103 |
1.3% |
|
11-20 |
5010 |
6.1% |
|
21-30 |
1425 |
1.7% |
|
31-40 |
626 |
0.8% |
|
41-50 |
347 |
0.4% |
|
51-60 |
188 |
0.2% |
|
61-70 |
110 |
0.1% |
|
71-80 |
37 |
0.0% |
|
81-90 |
24 |
0.0% |
|
91+ |
7 |
0.0% |
Amount of Ranking Fluctuation, by page
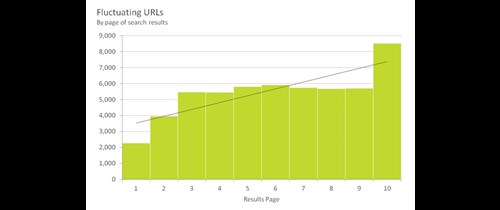
Next, take a look at the same data but plotted according to which page the URLs fluctuated within. In this chart the green bars represent the number of URLs that fluctuated within a given page of the Google results. For example, about 4,000 URLs fluctuated within page 2 of the Google results (that is, positions 11-20) while about 6,000 URLs fluctuated within page 6 (positions 51-60).

Why is this interesting? Because it illustrates how as you progress up the SERPs towards page 1, the competition (mostly in terms of link building) gets tougher and tougher, so small changes are less likely to cause ranking fluctuations. Conversely, on page 10 of the SERPs there is much less competition, so small changes to pages and link profiles cause rankings to fluctuate much more readily. This is something that most SEO's know innately, so it's nice to see some actual quantifiable data supporting that.
I've put a trend-line in here, but I think the key point is the cliff-face drops in fluctuations we see once you get to page 2 and page 1 of the results.
Note that this chart represents 54,520 fluctuations within a specific page; the other 27,960 URLs that fluctuated moved from one page of the results to another. Again, here's the data in tabular form:
|
SERP Page |
Fluctuating URLs |
|
1 |
2,264 |
|
2 |
3,957 |
|
3 |
5,475 |
|
4 |
5,454 |
|
5 |
5,811 |
|
6 |
5,908 |
|
7 |
5,741 |
|
8 |
5,679 |
|
9 |
5,712 |
|
10 |
8,519 |
Type of Ranking Fluctuation
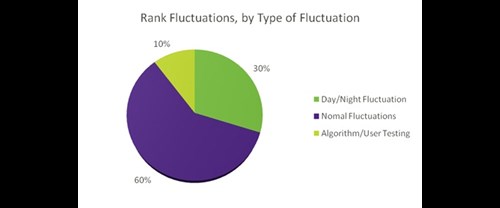
We observed what appear to be three distinct patterns of ranking fluctuations in our test. These are: day/night fluctuations, permanent or semi permanent rank changes (what we'll call "normal" fluctuations), and algorithm/user testing.
Here's a chart that shows the breakdown of the 82,480 fluctuating URLs in terms of what type of fluctuation they experienced:

Day/Night Ranking Fluctuations
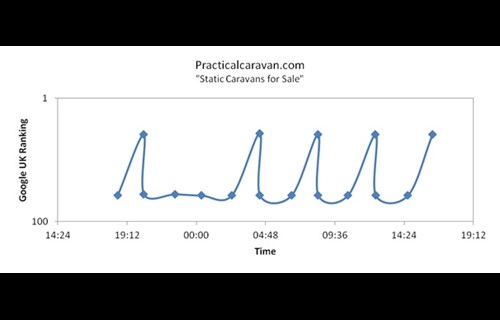
A day/night fluctuation is exactly what it sounds like: rankings change at night, remain consistent throughout the night, then return to their normal day time position the following day. Here are a couple of examples:
We think that this occurs because Google routes some search queries during the night to different data centres, perhaps for maintenance reasons. This sometimes results in different rankings because search engine data centres don't always store exactly the same information (they are synchronised routinely, but it's always possible to catch them in an un-synchronised state as well).
Considering this, it's worth noting that if your night time rankings are different to those during the day, then they could be foreshadowing things to come for your day time rankings.
It's also possible that Google sometimes thinks people who search at night are looking for different types of sites, although that seems less likely given the types of search terms we tested on.
Normal Ranking Fluctuations
Often rankings just change. One minute they are stable in one ranking position, the next they are stable in another, and they don't return to where they were. These normal fluctuations are the result of new or different algorithmic signals being taken into account by Google's algorithm.

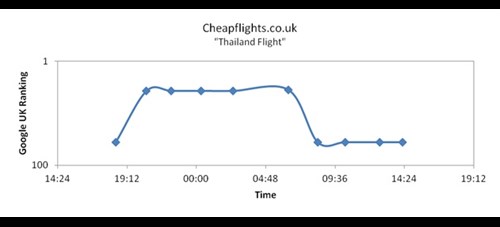
Note, arguably our test didn't last long enough to properly identify normal ranking fluctuations. The above could be cyclical rank changes over a longer time frame than we checked. However, this pattern is different enough to the other two that it's worth highlighting, and given the fact that normal ranking fluctuations should logically be the most common type of fluctuation, I'm confident that the majority of our sample are in fact fluctuations of that type.
Algorithm Testing or User Testing Fluctuations
These are the most interesting cases, as they graphically show the yo-yo effect that many SEO's will be quite familiar with. This is where a page swaps consistently between two different ranking positions, as in the following examples:
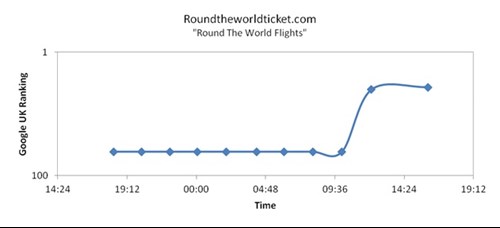
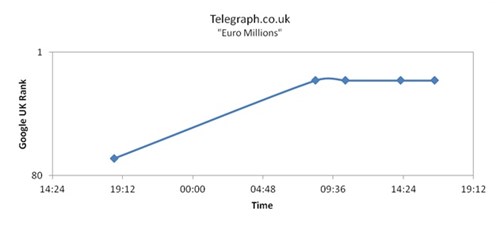
Typically this behaviour occurs when search engines are testing an algorithm change. If you watched Google's recent video about all the algorithm changes they test, this is the kind of thing they're talking about. In that video, Amit Singhal states that Google made over 500 algorithm changes last year, and obviously there are many tests that don't make it to the lofty heights of an official change, so these tests are relatively common and it's no surprise to see some of them cropping up in our experiment.
The alternative scenario here is that Google is testing how well users respond to a particular page ranking in the search results by artificially improving its ranking for intermittent periods, looking at user signals like click through rates, bounce rates, engagement time and so on.
In any case, if after a long enough test period it looks to Google like the page or algorithm change being tested may perform quite well in terms of user reaction, then the ranking change will become permanent.
Well, at least as permanent as any ranking change can be considered...
 I'd like to end this post by thanking Michael Leznik, PhD of Hydra, without whose invaluable input I would not have had such thorough analysis nor, in all likelihood, would I have been able to fully comprehend exactly what it was I was looking at. Dr Mike (as he's commonly referred to around here) is the Chief Scientist for Hydra and somewhat pertinently for this experiment specialises in, among other things, statistical pattern recognition.


